A new set of ISA software tools have been developed out of the EU H2020 PhenoMeNal: Large-Scale Computing for Medical Metabolomics project, which we introduced in this earlier blog post.
![]()
The 2018-02 release of PhenoMeNal, also known as “Cerebellin”, was released end of February 2018. It represents a major upgrade to the 2017-08 production release. It has a richer set of tools, depends on improved deployment software, includes improved workflows for Mass Spectrometry (MS) and Nuclear Magnetic Resonance (NMR) data, and strengthens massively the resilience infrastructure deployments under high load. PhenoMeNal comprises of cloud-based portal infrastructure that includes the Galaxy workflow system customised to run on the Kubernetes container orchestrator, with Galaxy tools running their processing in Docker containers in the cloud. PhenoMeNal, and thus our new ISA Galaxy tools, work in Galaxy running various cloud-computing infrastructures including Amazon Web Services, Google Cloud Platform, Microsoft Azure, OpenStack and KVM.
The ISA team has been contributing to the project since 2015, and has been collaborating on the development of user-facing, cloud-based data management and processing infrastructure in the project. The Cerebellin release of the PhenoMeNal software includes a new set of ISA-related Galaxy workflow tools, as well as native support for the ISA-Tab format in Galaxy. The tools work with the MetaboLights database as well as with ISA-Tab studies uploaded directly into the Galaxy platform, and builds on the Python ISA-API.
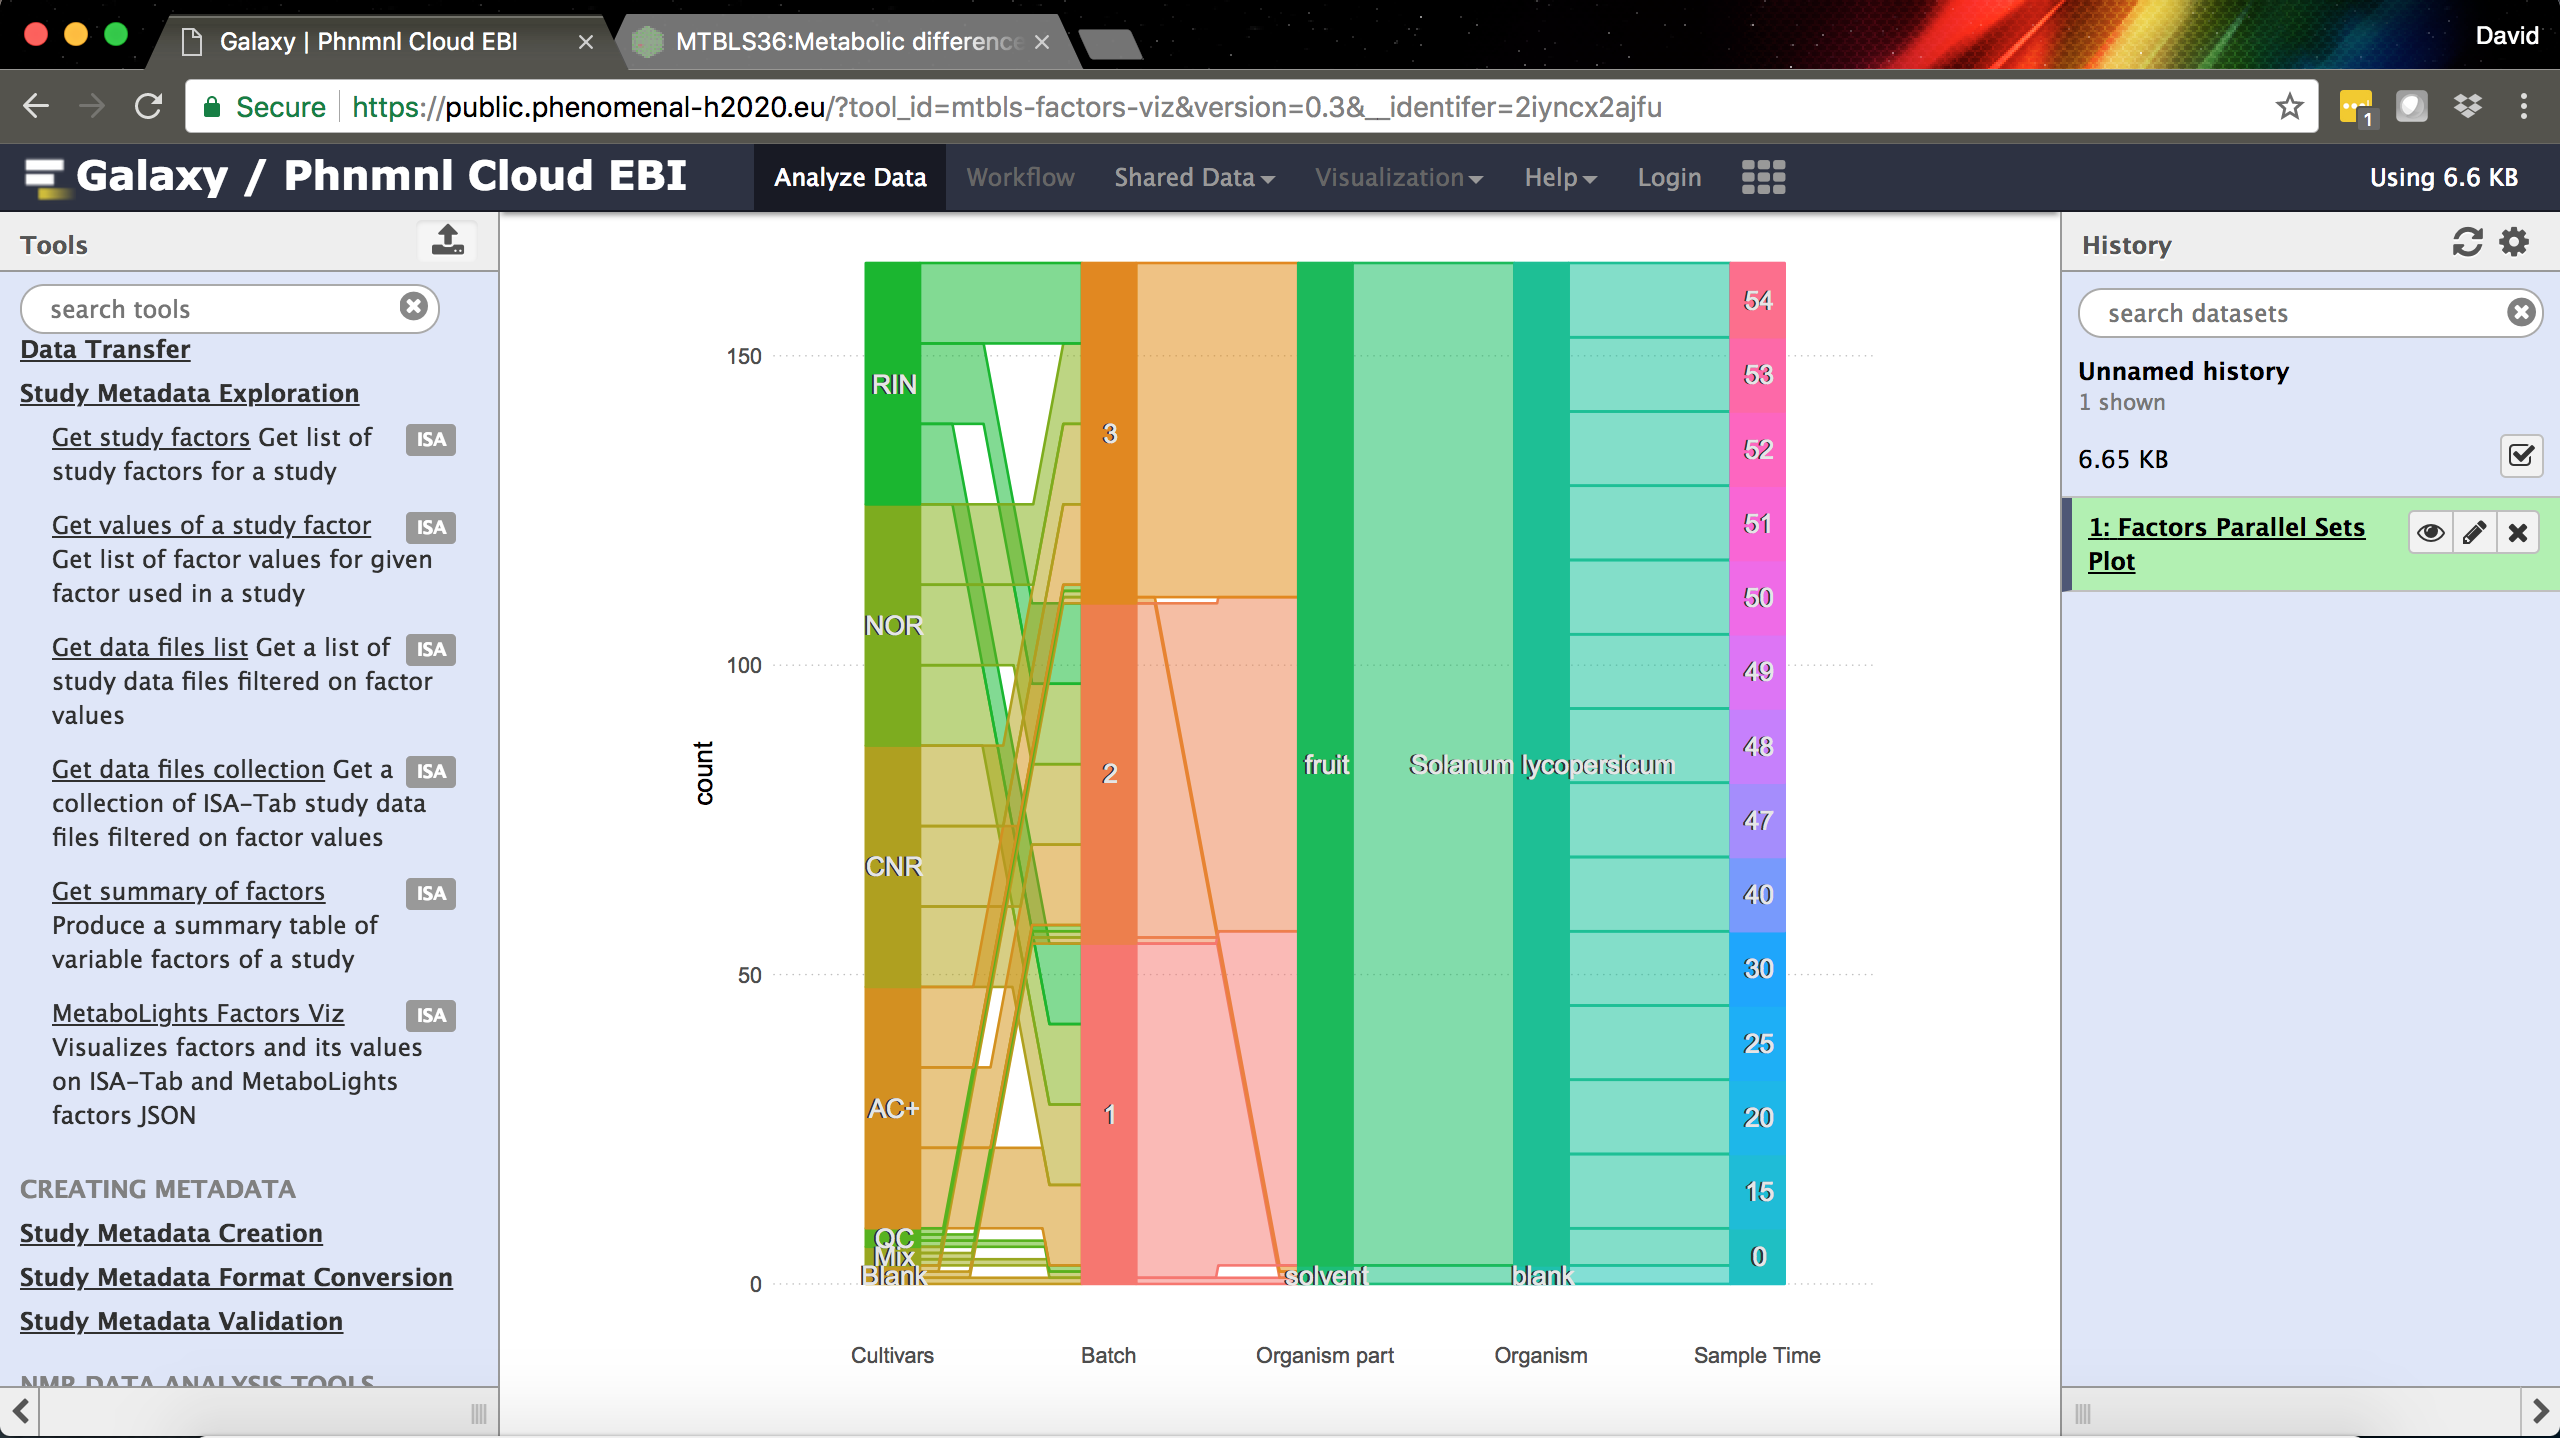
The MetaboLights/ISA-Tab Factors Visualization tool in Galaxy.
The new ISA Galaxy tools include:
- Metabolights downloader (W4M), developed with our colleagues at CEA, downloads MetaboLights studies in the new Galaxy “isa-tab” data type.
- Study Metadata Exploration tools (5 different tools) that allows querying over ISA-Tab data based on study factor slicing.
- MetaboLights Factors Viz – a tool developed with our colleagues at EMBL-EBI for visualizing a summary of study factors as a parallel sets plot.
- Format conversions from ISA-Tab (using the “isa-tab” Galaxy data type) to ISA-JSON and to W4M (developed by CEA).
- ISA-Tab validation, again using the “isa-tab” Galaxy data type.
- mzml2isa and nmrml2isa – Automated study metadata creation in ISA-Tab using the “isa-tab” Galaxy data type, from mlML and nmrML data, developed with our colleagues at the University of Birmingham.
- And finally, an interactive tool to create prospective ISA-Tab study templates as “isa-tab” Galaxy data types, based on study design information. This tool supports generating assays for both MS and NMR, using standardised file naming templates compatible with Phenome Centre Birmingham and the MRC-NIHR National Phenome Centre at Imperial College London. The tool shares curation practices with those used by the MetaboLights database and implements the Metabolomics Standards Initiative (MSI) reporting guidelines that go towards making metadata and data FAIR.
We are also developing extensions to our Galaxy tools to support NGS and DNA microarray data, and to enable direct deposition to public repositories, such as those hosted by EMBL-EBI, via Galaxy workflows.
You can try out our ISA Galaxy tools in the Cerebellin release of PhenoMeNal in the public PhenoMeNal Galaxy server. The next scheduled release of PhenoMeNal will be the Dalcotidine release scheduled for August 2018.